

A Spring application is basically made up of Spring beans, “wrappers” of actual Java classes that are created by Spring framework at start-up (or on request if lazy-initialized) and injected as dependency where needed. That said, the start-up procedure of a Spring Boot application can be seen as a Tree, in which the roots are some internal Spring procedures and intermediate and leaf nodes are beans initializations. If bean “A” needs bean “B” as dependency, B will be child of A and the time needed to initialize bean A will be the time needed by A itself plus the summed time of its children.
Getting an insight on the start-up procedure of a Spring Boot application is actually very simple, you just need to activate the Spring Boot StartUp actuator.
Once activated, the startup events will be published via the “/actuator/startup” HTTP endpoint.
1
2
3
4
5
6
7
8
9
10
11
12
13
14
15
16
17
18
19
20
21
22
23
24
25
26
27
28
29
30
31
32
33
34
35
36
37
38
39
40
41
42
43
44
45
46
47
48
49
50
51
52
53
54
55
56
57
58
59
60
61
62
63
64
65
66
67
68
69
70
71
72
73
74
{
    "springBootVersion": "2.7.2",
    "timeline": {
        "startTime": "2022-12-01T10:25:47.480064631Z",
        "events": [
            {
                "endTime": "2022-12-01T10:25:47.543243140Z",
                "duration": "PT0.045062101S",
                "startTime": "2022-12-01T10:25:47.498181039Z",
                "startupStep": {
                    "name": "spring.boot.application.starting",
                    "id": 0,
                    "tags": [
                        {
                            "key": "mainApplicationClass",
                            "value": "com.pdemartino.ApplicationKt"
                        }
                    ],
                    "parentId": null
                }
            },
            {
                "endTime": "2022-12-01T10:25:48.690322544Z",
                "duration": "PT0.91235095S",
                "startTime": "2022-12-01T10:25:47.777971594Z",
                "startupStep": {
                    "name": "spring.boot.application.environment-prepared",
                    "id": 1,
                    "tags": [],
                    "parentId": null
                }
            },
            {
                "endTime": "2022-12-01T10:25:48.925252495Z",
                "duration": "PT0.000187068S",
                "startTime": "2022-12-01T10:25:48.925065427Z",
                "startupStep": {
                    "name": "spring.boot.application.context-prepared",
                    "id": 2,
                    "tags": [],
                    "parentId": null
                }
            },
            {
                "endTime": "2022-12-01T10:25:49.066986886Z",
                "duration": "PT0.003744429S",
                "startTime": "2022-12-01T10:25:49.063242457Z",
                "startupStep": {
                    "name": "spring.boot.application.context-loaded",
                    "id": 3,
                    "tags": [],
                    "parentId": null
                }
            },
            {
                "endTime": "2022-12-01T10:25:49.162692120Z",
                "duration": "PT0.011435772S",
                "startTime": "2022-12-01T10:25:49.151256348Z",
                "startupStep": {
                    "name": "spring.beans.instantiate",
                    "id": 7,
                    "tags": [
                        {
                            "key": "beanName",
                            "value": "org.springframework.boot.autoconfigure.internalCachingMetadataReaderFactory"
                        }
                    ],
                    "parentId": 6
                }
            },
            ...
        ]
    }
}
Every event represents a step executed during the start-up procedure, the following pieces of information are provided:
- startTime and endTime: timestamp when the start-up step beging and when it finishes
- duration: a string containing the step duration, S suffix indicates seconds while M minutes
- startupStep.name: a step identifier (not unique), startipStep.name = “spring.beans.instantiate” indicated the creation of a Spring bean (the name of which can be found in the “tags” array)
- startupStep.id: unique identifier of the start-up step, it’s not supposed to be preserved across different hosts and deployments, hence name can be used as pivot
- startupStep.parentId: start-up events can be seen as a tree, this field define dependencies between steps, parentId = null indicates roots of the tree
This diagram shows a simplified example of a Spring Boot application start-up procedure:
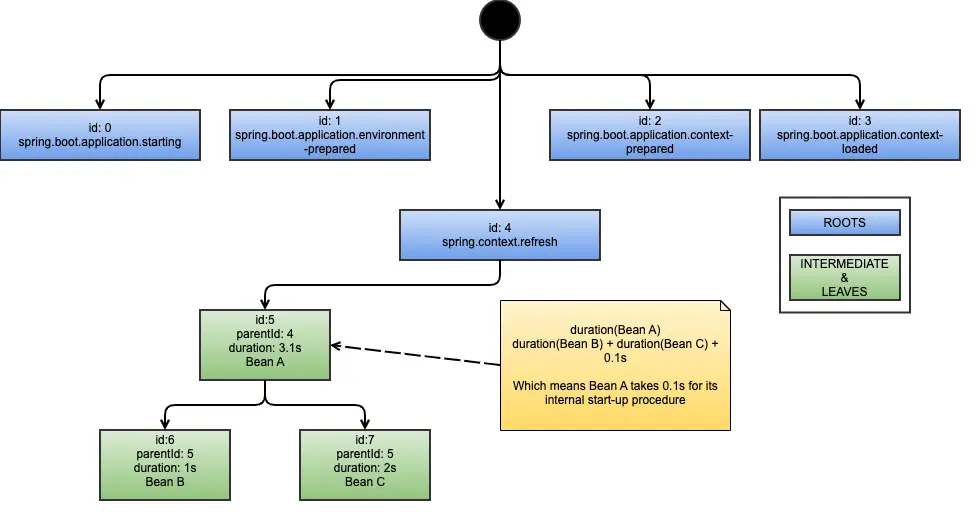
Note, the duration reported by the actuator might be misleading. If you consider the example in the diagram above, you might think Bean A is time-consuming because duration reported by the actuator is 3.1 seconds, in fact that beans only takes 0.1 seconds to instantiate itself, while it waits 3 seconds for its dependencies.
Even though that JSON contains all the information, the reverse relationship (child → parent) and the fact that the net duration of intermediate steps is not explicit, some post-processing is required for extracting statistics useful to understand where bottlenecks are and on which bean you should focus on.
In order to extract useful (for our case) statistics out of the Startup Actuator, we used the springboot-startup-stats script (source code available on GitHub).
If you’re running on Mac, you can install it by running the following commands:
1
2
brew tap pdemartino/tap
brew install springboot-startup-stats
If we run the script against the startup endpoint, it will provide a tree representation of its content:
1
2
3
4
5
6
7
8
9
10
11
12
13
14
15
16
17
18
19
20
21
22
23
24
$ ENDPOINT=https://localhost:8080/actuator/startup
$ springboot-startup-stats --mode tree  $ENDPOINT
Source: https://localhost:8080/actuator/startup
Mode: tree
Offending Threshold: 1.7976931348623157E308
Tree Root:

[0]spring.boot.application.starting - t:0.038712606
[1]spring.boot.application.environment-prepared - t:0.765441
[2]spring.boot.application.context-prepared - t:1.46107E-4
[3]spring.boot.application.context-loaded - t:0.00252148
[4]spring.context.refresh - t:0.3018837 - ∑t:38.849705s
├──[5]spring.context.beans.post-process - t:0.020615578 - ∑t:3.4185178s
│   ├──[6]...ng.beans.instantiate:org.springframework.context.annotation.internalConfigurationAnnotationProcessor - t:0.06522767 - ∑t:0.07434817s
│   │   └──[7]spring.beans.instantiate:org.springframework.boot.autoconfigure.internalCachingMetadataReaderFactory - t:0.009120496
│   ├──[8]spring.context.beandef-registry.post-process - t:0.04540038 - ∑t:2.6865594s
│   │   └──[9]spring.context.config-classes.parse - t:2.641159
│   ├──[10]spring.context.bean-factory.post-process - t:2.51665E-4
│   ├──[11]spring.context.bean-factory.post-process - t:6.455E-6
│   ├──[12]spring.context.bean-factory.post-process - t:9.2838705E-4 - ∑t:0.20036256s
│   │   └──[13]spring.context.config-classes.enhance - t:0.19943418
│   ├──[14]spring.context.bean-factory.post-process - t:4.4913E-5
│   ├──[15]spring.beans.instantiate:customBean - t:0.003065169
...
Among other pieces of information, the output contains:
- the parent→children relationship (reversed if compared with Actuator output)
- the tree duration “∑t”, which is the same reported by the startup endpoint
- the net duration “t”, which indicates exactly how long that bean takes, dependencies excluded
The net duration “t” is the value we want to focus on in order to identify slow beans. What we did on the service under test was to extract the list of the steps which used to take more than 1 second to start:
1
2
3
4
5
6
7
8
9
10
11
12
13
14
15
16
$ ENDPOINT=https://localhost:8080/actuator/startup
$ springboot-startup-stats --mode stats --offendingThreshold 1.0 $ENDPOINT
Source: https://localhost:8080/actuator/startup
Mode: stats
Offending Threshold: 1.0
Tree Root:
Number of nodes: 816
Number of roots: 7
Number of leaves: 540
Global duration: 39.693936485637096
Offending nodes: 5
[291]spring.beans.instantiate:beanA - t:16.057272 - ∑t:16.143324s
[485]spring.beans.instantiate:beanB - t:3.2487843 - ∑t:3.419284s
[287]spring.beans.instantiate:beanC - t:2.793414 - ∑t:2.8905766s
[9]spring.context.config-classes.parse - t:2.641159
[72]spring.beans.instantiate:beanD - t:1.8581195 - ∑t:2.7454188s
Given that output, we might want to get an insight, for example, on beanA bean and figure out why it takes 16.05 seconds to start, while its dependencies only take 0.09 seconds (∑t - t):
1
2
3
4
5
6
7
8
9
10
11
12
$ ENDPOINT=https://localhost:8080/actuator/startup
$ springboot-startup-stats \
> --mode tree --treeRoot spring.beans.instantiate:beanA \
> $ENDPOINT
Source: https://localhost:8080/actuator/startup
Mode: tree
Offending Threshold: 1.7976931348623157E308
Tree Root: spring.beans.instantiate:beanA

[291]spring.beans.instantiate:beanA - t:16.057272 - ∑t:16.143324s
├──[292]...s.instantiate:com.pdemartino.childA - t:0.010470834
└──[293]spring.beans.instantiate:com.pdemartino.childB - t:0.075581245
Next step would surely be profile your application to figure out what beanA is doing during its initialization.
Credits:
- Stopwatch photo by Tsvetoslav Hristov on Unsplash
Comments powered by Disqus.